Gamma Exposure
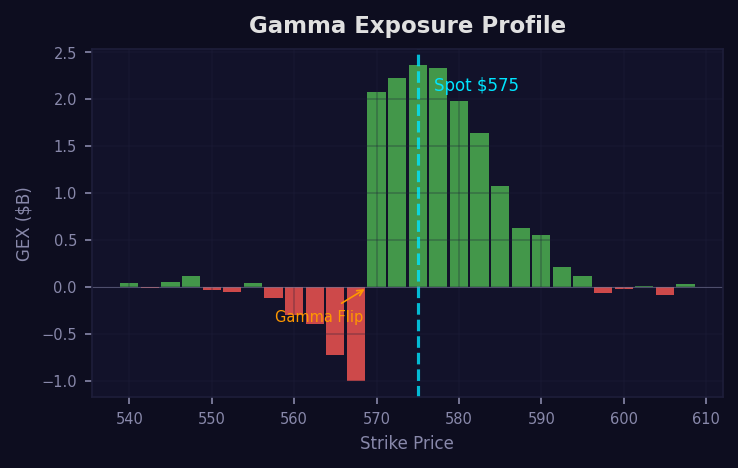
Per-strike gamma profile reveals dealer hedging pressure. Green bars = upward support, red bars = downward pressure. Spot the gamma flip where dealers switch from stabilizing to amplifying.
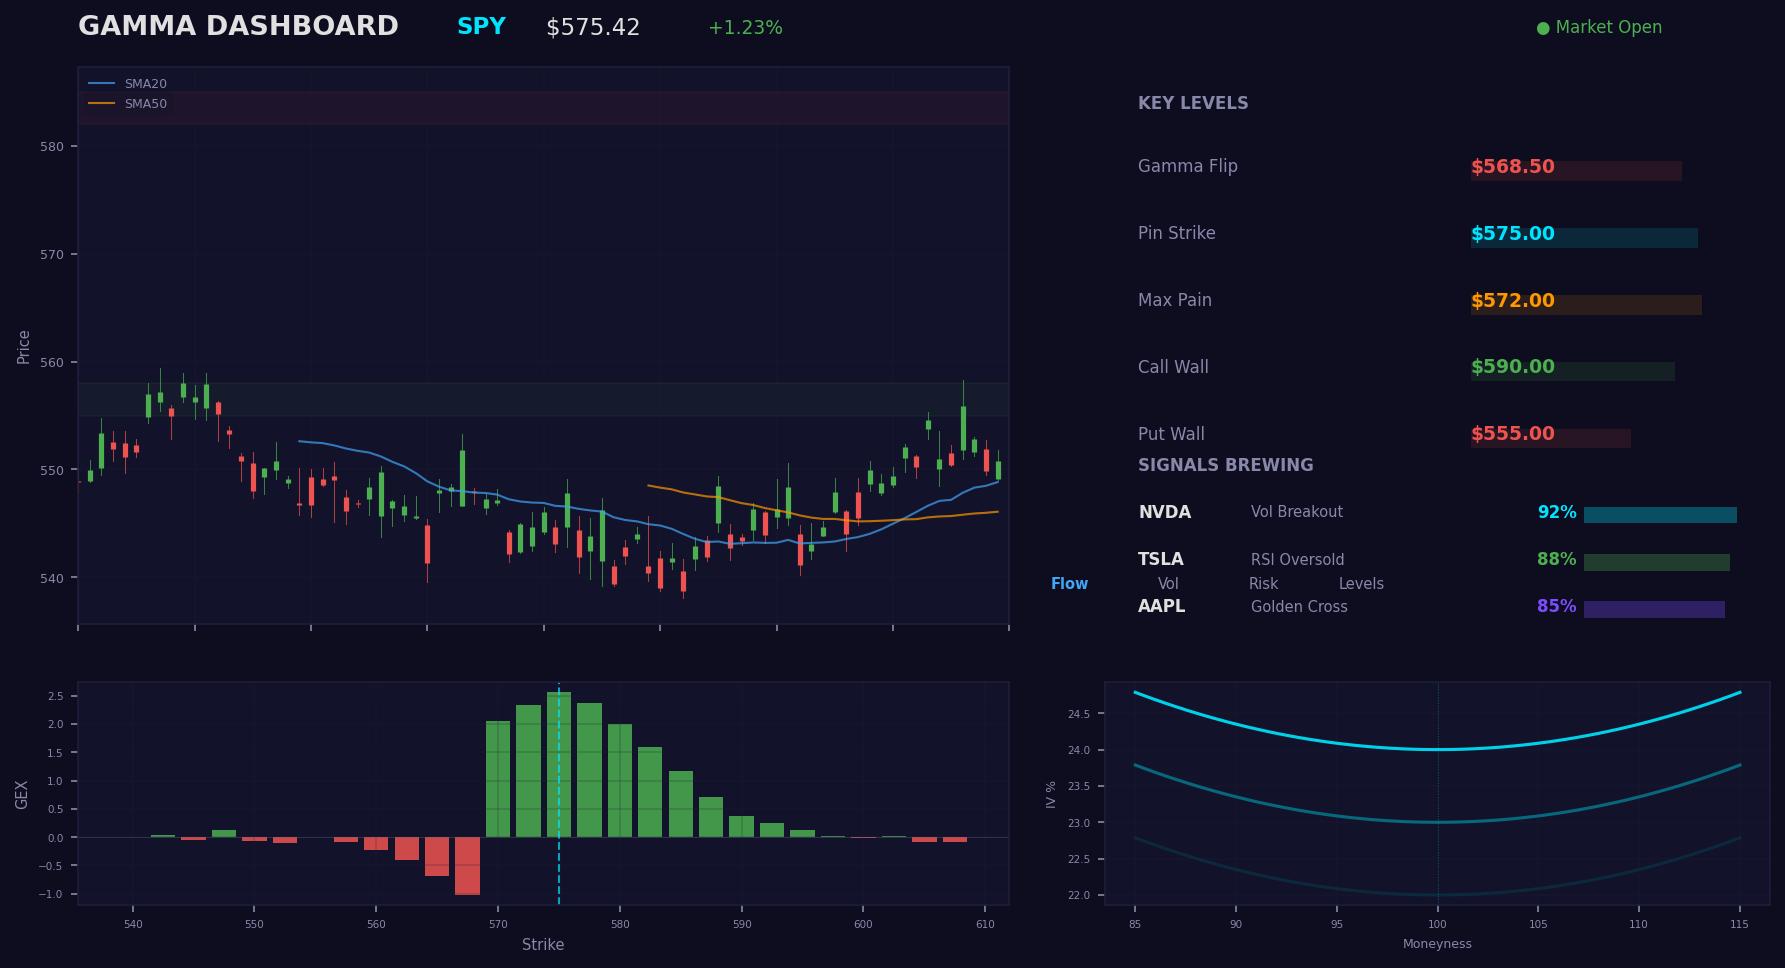
Options-driven market intelligence. See where dealers are hedging, where price is pinned, and what's about to break out — all in one view.
 Free
Free
Per-strike gamma profile reveals dealer hedging pressure. Green bars = upward support, red bars = downward pressure. Spot the gamma flip where dealers switch from stabilizing to amplifying.
 Free
Free
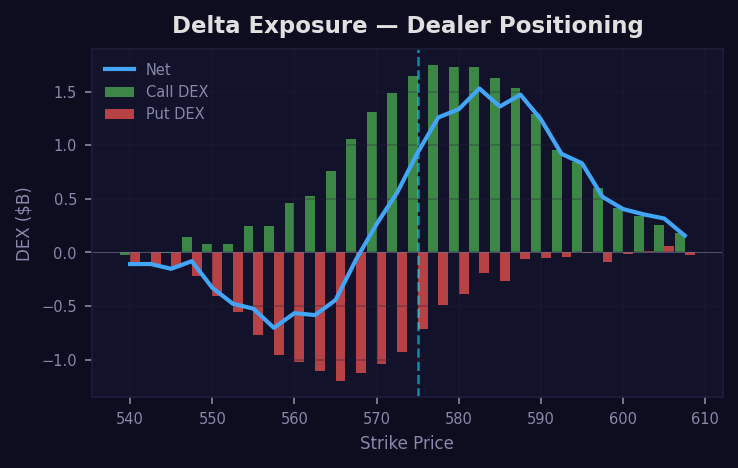
Split call/put DEX profile shows exactly how much stock dealers must hold to stay hedged. Net positive = dealers buying. Net negative = dealers selling. Directional bias at a glance.
 Free
Free
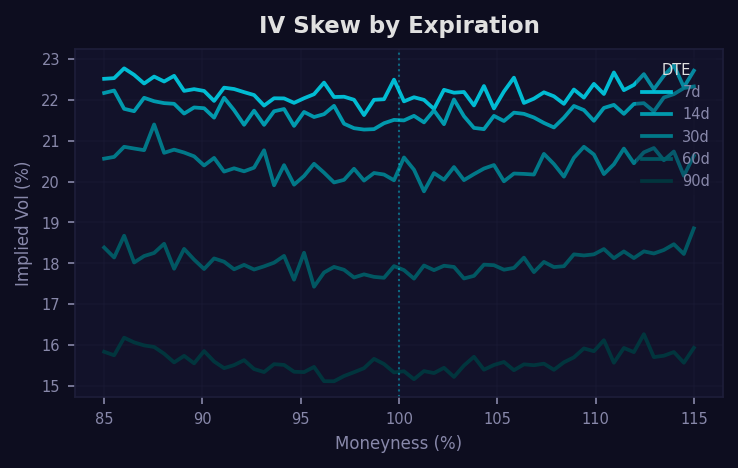
Volatility smile across multiple expirations. Near-term curves bright, far-term dim. Spot contango/backwardation shifts and skew steepening before it moves price.
 Pro
Pro
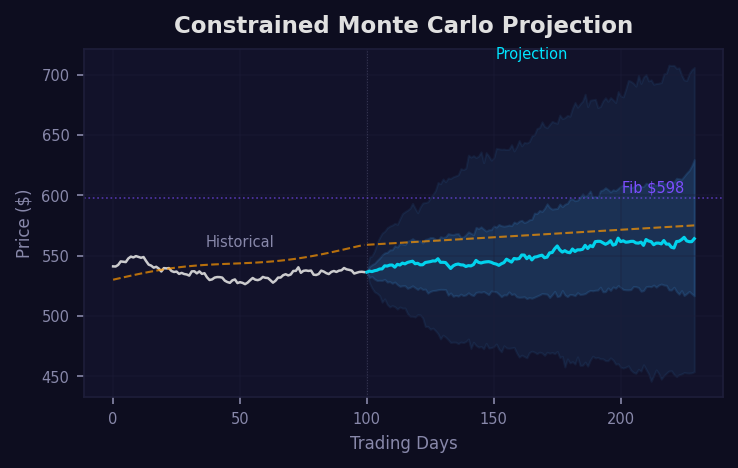
SMA200 tangent targets a Fibonacci level. 5,000 MC paths filter to only those consistent with the target. Surviving paths form the probability cone — not a guess, a constraint.
 Pro
Pro
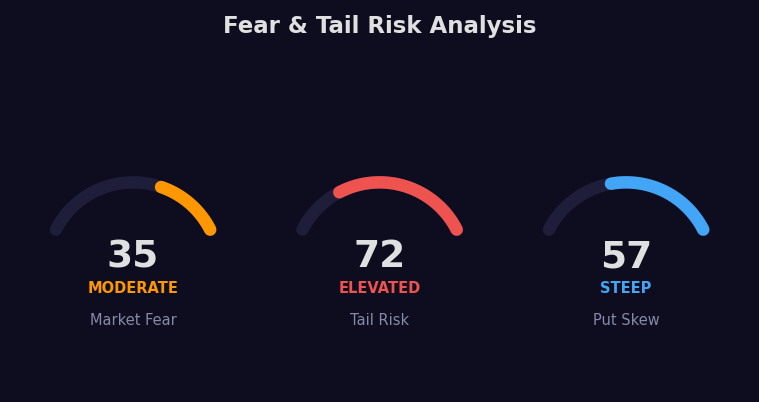
Risk reversal + butterfly metrics gauge market fear in real time. Moderate, elevated, or extreme — know whether the market is complacent or bracing for a move.
 Pro
Pro
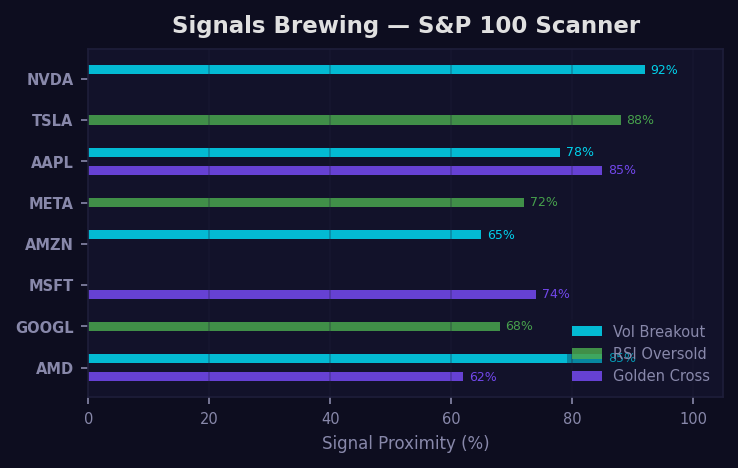
19 ATR-normalized strategies scanned across the S&P 100. See which signals are 85%+ to trigger. Confluence of 3+ strategies on one ticker = high-conviction setup.
Type any S&P 500 symbol. Options chain data is fetched and processed in real-time.
GEX, DEX, Vanna, Charm — see where dealers are hedged and what that means for direction.
Signal scanner shows what's about to fire. Backtest tells you how it's performed historically.